
Background to Flood Risk Mapping
In Scotland Flood Risk Mapping is now undertaken at a national scale by Scottish Environmental Protection Agency (SEPA) under its obligations within the Flood Risk Management (Scotland) Act 2009 (the FRM). These maps identify a major flood risk to Musselburgh from the River Esk (fluvial flood risk) and the Firth of Forth (coastal flood risk), and the flood risk from water ponding on the ground (pluvial flood risk). These flood risk maps are updated every five years, and the flood maps may be accessed online at the SEPA website.
In 2015, Kaya Consultancy developed a hydraulic flood model of the River Esk through which the flood risk to the town from the river was assessed. This modelling work confirmed the major flood risk identified by previous flood models including the SEPA national model. This work led to the establishment of this Scheme on the national Programme of Flood Protection Schemes.
Determining a level of protection
There are many levels of flood risk, and the project has undertaken an assessment of all normal levels of flood risk through its Flood Risk Assessment.
East Lothian Council has determined the Standard of Protection that the Musselburgh Flood Protection Scheme should be to provide an appropriate level of flood risk reduction to the town. This is described as the level of protection against the ‘design event’ and is:
To protect against a 0.5% AEP* Flood Event, plus an allowance for climate change, plus a strategy for future flexibility.
* AEP = Annual Exceedance Probability
Scheme Hydraulic Flood Model – Model C
What is the Flood Risk to Musselburgh?
The Project Team’s understanding and presentation of Musselburgh’s flood risk has evolved since the project’s inception. This was done to incorporate new data, comply with changes in guidance, and acknowledge feedback from the public. As a result, the associated flood risk maps have changed over time.
Jacobs’ assessment of flood risk commenced during Stage 3 of the project, with the production of ‘Model A’ in 2018. This was replaced in 2020 by ‘Model B’ to incorporate revised river gauge data from SEPA, revised climate change guidance, and improved catchment schematisation. In 2022 this was replaced by ‘Model C’, the current and most up-to-date flood model for Musselburgh. This latest revision incorporated further changes to climate change guidance, improved coastal survey data, and improved schematisation to better reflect coastal flooding mechanisms.
Model A considered the present-day flood risk from a 0.5%AEP event, as well as the increased in flood risk resulting from a worst-case estimate of the effects of climate change by 2125. At this time the latest data on climate change projections was UKCP09. Model B took a similar approach, but its climate change scenario was based on the newer UKCP18 data which by then had been published. Model C was developed in response to the public’s feedback and, instead of considering only one climate change scenario, it considered the present-day flood risk plus three different climate change scenarios. These comprised a medium emissions scenario in the 2050s, a high emissions scenario in the 2070s, and a high emissions scenario by 2100.
Present-day Risk
Musselburgh already has considerable flood risk today, originating from three different sources: The River Esk, the Pinkie Burn, and the Forth Estuary. Flood risk maps of the 0.5%AEP event from each of these sources are shown below. In the order of 900 properties are at risk from at least one of these events.


In August 2022, Full Council unanimously supported the Project Team’s recommendation that, as a minimum, the Scheme should protect Musselburgh from these three flood events.
The Effect of Climate Change
Climate change would have the effect of increasing the flood risk to Musselburgh. This is because a rise in global atmospheric temperature would lead to a rise in sea level (primarily due to melting polar ice and thermal expansion of the oceans), and an increase in river flows (primarily due to greater rainfall intensity because of the capacity of a warmer atmosphere to hold more water vapour). This increase in flood risk means that a flood of a given magnitude would become more likely to occur in the future than it would today. There are many different scientific predictions of how much the global atmospheric temperature will increase by over the next century, all of which are based on an assumed amount of carbon emitted globally each year.
Credible Worst-case Flood Risk
Following discussions about Model B results with the public in February and March 2022, it was acknowledged that a climate change scenario based on high emissions in 2125 could be viewed as overly conservative. Consequently, Model C’s credible worst-case scenario was based on a high emissions scenario in 2100 instead. This was chosen to align with the criteria that a new residential planning application would be assessed against, under the latest planning guidance.
Flood risk maps of the 0.5%AEP event plus the credible worst case allowance for climate change are shown below. In the order of 3000 properties are at risk from at least one of these events.


Blended Flood Risk Mapping
The following blended flood risk maps show the total area at risk from at least one of the aforementioned flood maps (Esk, Pinkie, or Forth). This does not represent the possibility of all three events simultaneously, as the probability of that occurrence is infinitesimally small.


Scheme’s Interactive Flood Risk Map – Model C
The Scheme’s Interactive Flood Risk Map has been designed to benefit understanding of the current and future flood risk to Musselburgh. This map shows areas within the town that are likely to flood and to what extents from; the Pinkie Burn, River and Coastal, Costal and the River Esk (based on Jacobs’ ‘Model C’; most up-to-date flood model for Musselburgh, explained above).
This map is a public tool that offers the chance to navigate the town and select from layers of data presented to better understand the threat extents to Musselburgh by flooding. Please explore this interactive map using the Map Layers and Consultation Areas drop down selection menus. Visibility of layers can be turned on and off by selecting the eye icon next to each layer. The Property Units and Amenities and Population Density map layers include the location of; Amenities, Property Units, and Population Density. Different base maps can be selected, and dimensions taken using the measure icon. Print outs can be made using the indicated icon.
Scheme Hydraulic Flood Model – Model A
East Lothian Council appointed Jacobs as Design Consultant to advance the Scheme in December 2016. As part of this responsibility, they were required to confirm the flood risk to the town of Musselburgh from both the River Esk and the Firth of Forth. As part of this activity, the project undertook significant new topographic survey work across the town to verify ground levels. A review was also undertaken of river flow and sea level records, climate change projections, and changes in guidelines in approaches to Hydraulic Modelling.
The UKCP18 (United Kingdom Climate Projections 2018) was published in December 2018. This provides the current national approach to projecting changes for future flood risk from rivers and from the sea. The Scheme identified an approach to interpretation of it for the 2019 Flood Maps, but this was ahead of others. The Scheme therefore deemed this body of work to be its ‘Model A’ and committed to a revision of the model (i.e. ‘Model B’) in 2020 once the UKCP18 data was fully interpretated by national agencies and advice on its use was issued.
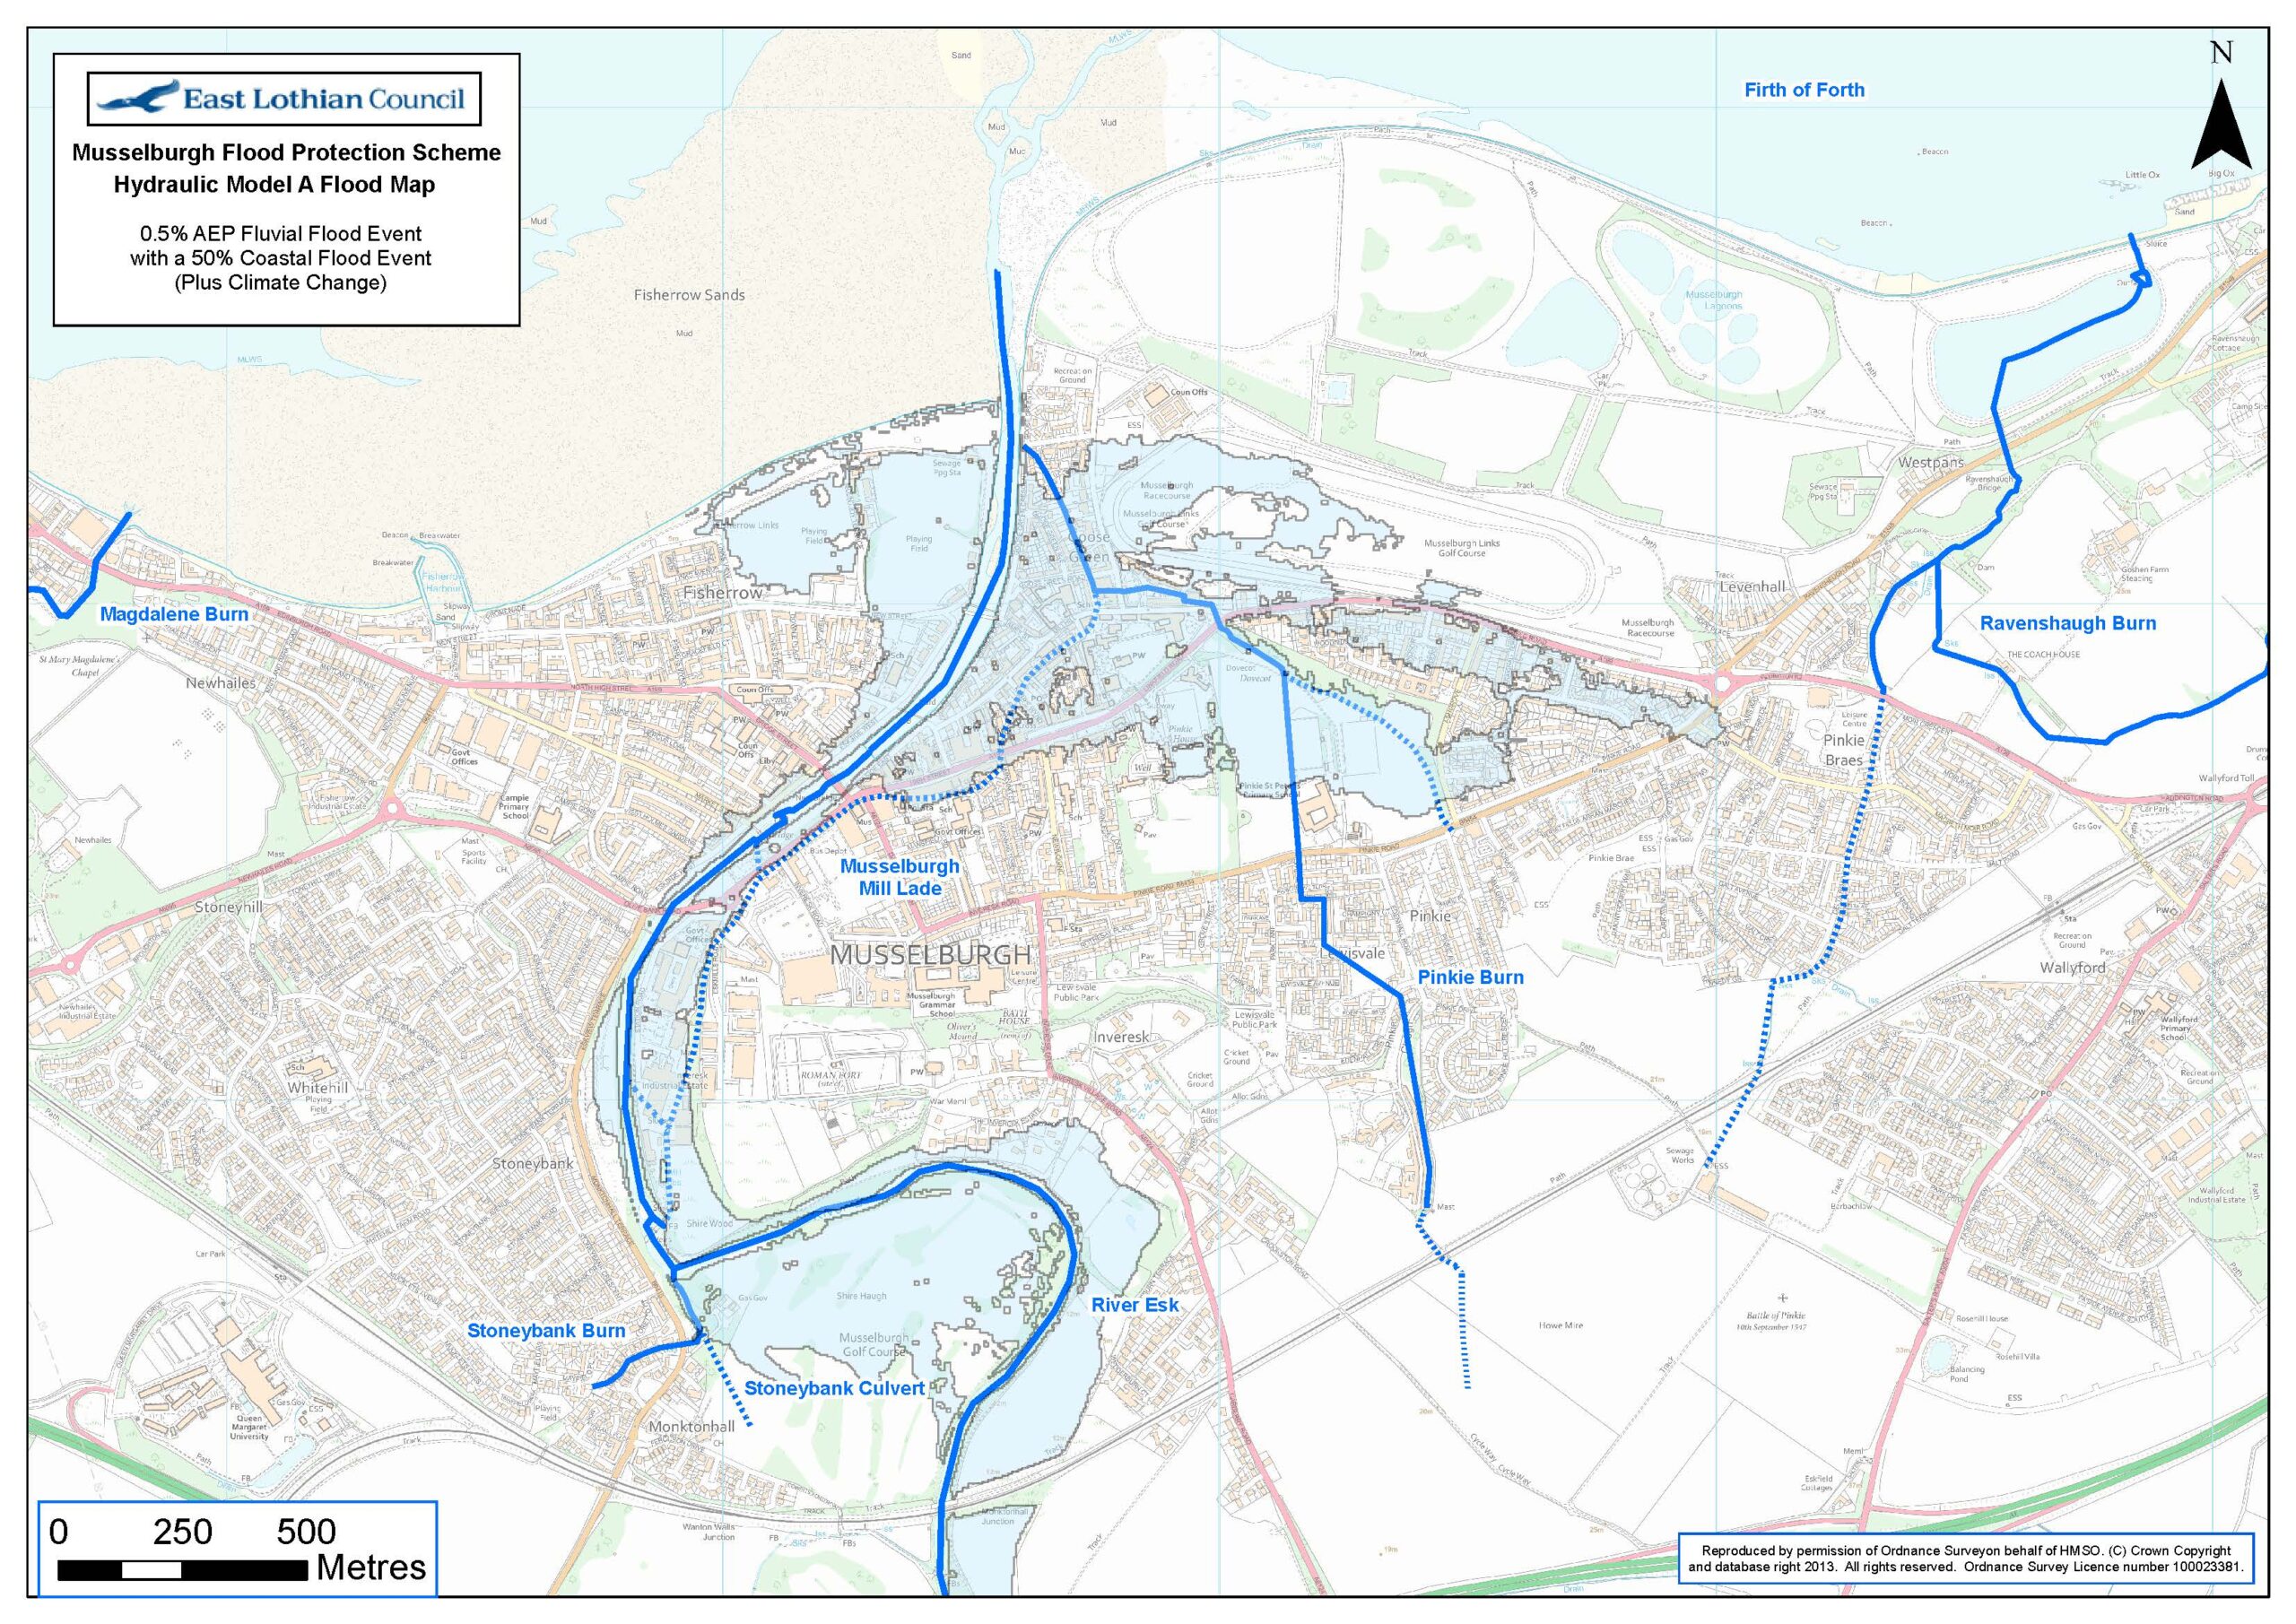
One Hydraulic Model has been developed to model flood risk form the River Esk.

Another Flood Model has been developed to model flood risk from the sea.

The Scheme will provide protection against each of these individual events. It will not provide protection against these events happening at the same time – this would not be a 0.5% probability event: it would have an event probability which was orders of magnitude lesser. The project has produced a ‘Blended’ Flood Map to provide an illustration of the overlapped flood envelope for both of these events, and thus the combined area of land and resultant properties protected by the Scheme. Many of these properties are protected against both events.
This flood risk was presented to the town of Musselburgh via its Public Exhibition No. 1 in July 2019.
Scheme Hydraulic Flood Model – Model B
The Scheme’s Model B is now finalised. This now incorporates the new UK guidelines on Climate Change from December 2018 into our approach. We have also absorbed purified catchment data from SEPA into our model, undertaken extensive ground surveying to achieve the most accurate ever representation of the ground and thus the flow-paths for water, and we have accepted SEPA’s advice in developing the model.


What does the Blended Map show?
Before a Flood Protection Scheme can design new flood defences, it is necessary to clearly understand and define the flood risk. This map illustrates the flood risk to Musselburgh from the design event. The Flood Protection Scheme will develop an approach to stop this water inundating these areas.
How many properties are at risk in Musselburgh?
In the order of 2,500 properties are at risk of the major flood event (the design flood event) that the flood protection scheme is working to protect against. This includes: the whole of the High Street and the Eskmills Business Park area; the Musselburgh Racecourse; Fisherrow Harbour; significant parts of Loretto School and its grounds; the A199; the town’s two road bridges and all of its footbridges; along with thousands of residential properties and businesses. The Project Team will now commence a detailed Land Referencing activity to fully understand the scale of the social and property impact of this flood risk.
